Service Desk Operational Dashboards & Reporting
Process & Project Manager · Live internal tool · 2024 — present
Operational dashboards that integrate Jira and internal tools to give leadership a single view of project progress, service-desk performance, priorities and team workload.
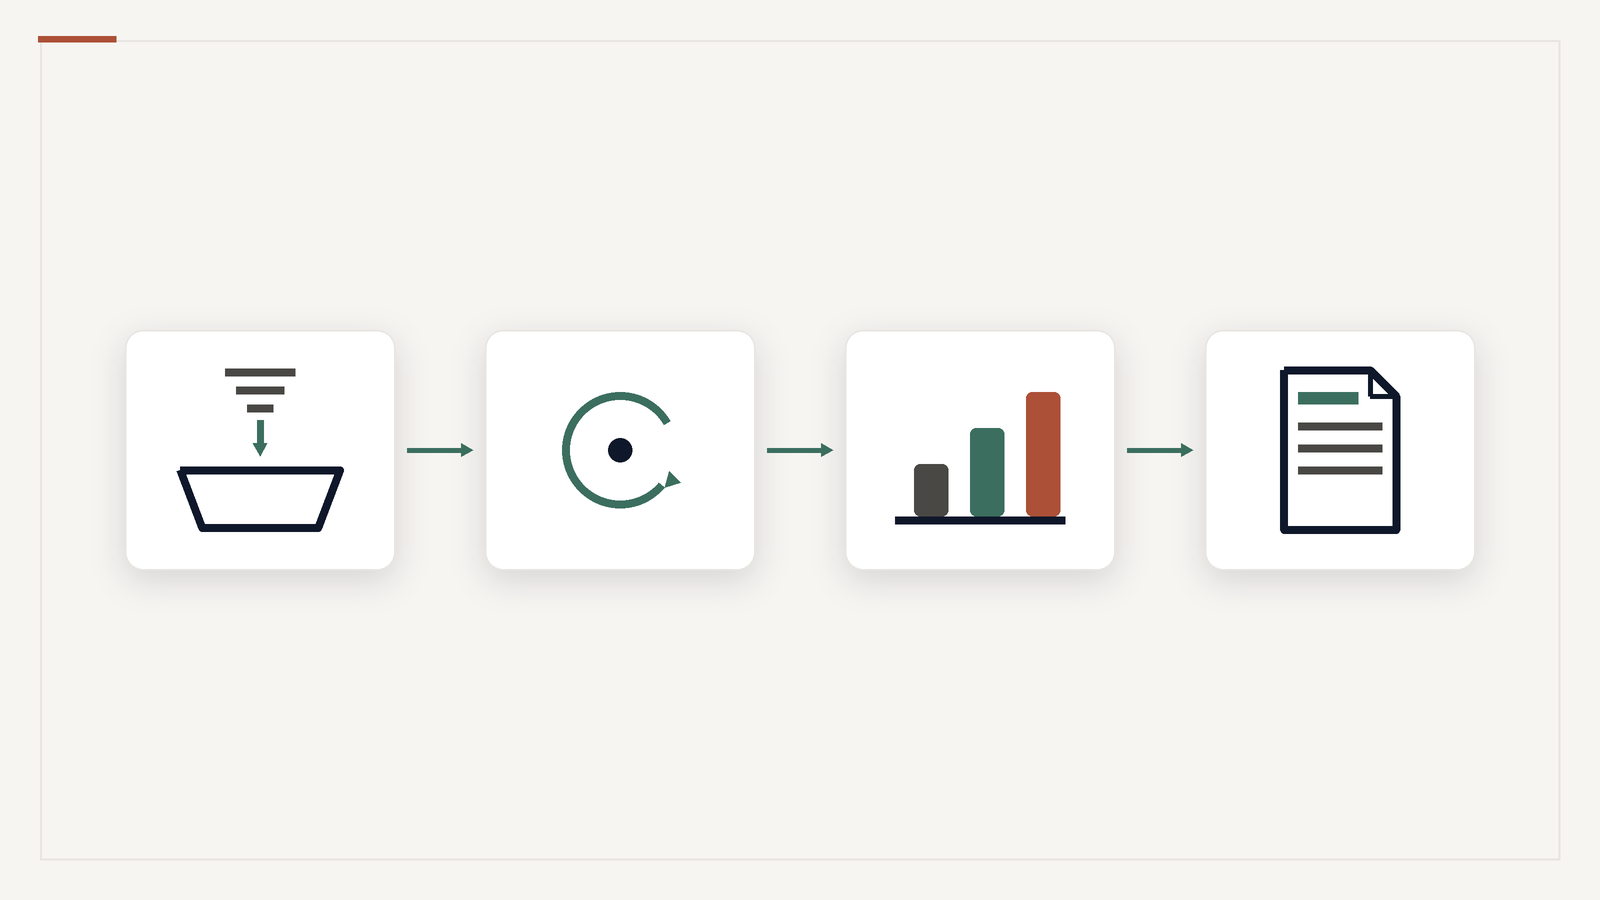
Service Desk Operational Dashboards give leadership and operations teams a single place to see project progress, priorities, service-desk performance and team workload. Built around Jira and internal tools, the dashboards feed into weekly executive reporting.
The opportunity
Without a unified view, leadership had to piece together status from separate tools, and agents lost time switching between systems. The team needed dashboards that made decisions obvious and reduced daily friction.
My role
I built and maintained the dashboards and reporting as part of my service-desk process and project-management work, coordinating across Customer Service, Product and Engineering (15+ stakeholders) and using the dashboards to keep weekly executive reporting consistent and actionable.
Key work completed
- Operational dashboards integrating Jira and internal tools.
- A performance system for the Service Desk Department with weekly stats, tickets closed, global satisfaction and monthly team comparisons, adding competitive factors that boosted productivity.
- A single-page Jira ticket collection so agents could handle daily tasks without tool switching.
- Process and project documentation to keep updates, specifications and service-desk knowledge accessible.
Results & current status
The dashboards are in production and used for weekly executive reporting. The broader service-desk improvement programme is linked to a ~25% improvement in first-contact resolution, a ~15% reduction in escalation volume and a ~20% reduction in average project delivery time. These outcomes reflect the whole programme, not the dashboards alone.
Tools & methods
- Jira
- Confluence
- Internal integrations
- Operational KPIs
- Executive reporting
- Dashboard design
- Stakeholder coordination
- Process documentation
Lessons learned
Dashboards only create value when they are tied to decisions. A single-page, integrated view reduces tool switching, and clear performance metrics help teams self-correct. Documentation is as important as the tool itself.